Server Placement Patterns and Activity Trends in Consolidated Casino Networks
Quinn Hughes · Aug 12, 2026
Server Placement Patterns and Activity Trends in Consolidated Casino Networks
Research from industry monitoring groups shows that data center locations correlate with measurable differences in session lengths and repeat visit rates across platforms that combine multiple casino operators under shared backend systems. Operators have tracked these patterns through aggregated user data since the expansion of cloud-based casino networks in the early 2020s, and the figures continue to guide infrastructure decisions into August 2026.
Latency Measurements and Regional Performance Data
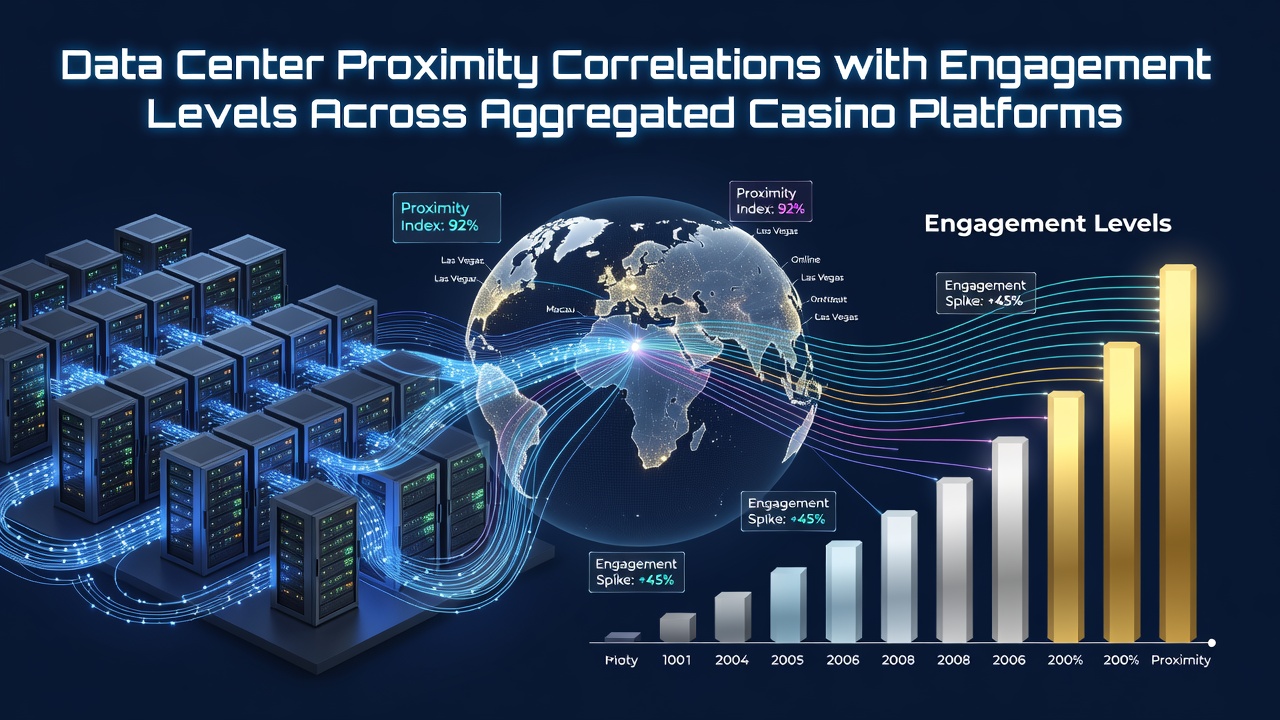
Studies conducted by university research teams in North America and Europe have documented that users connecting to servers within 50 kilometers experience average load times under 30 milliseconds, while distances exceeding 300 kilometers often push those times past 120 milliseconds. These differences appear consistently in logs from platforms that pool traffic from several licensed operators, and the resulting data sets allow direct comparison of engagement metrics such as spins per session and deposit frequency. One analysis covering platforms in the United States and Canada found that regions with nearby facilities recorded 18 percent higher average session durations than areas reliant on distant nodes.
Infrastructure Scaling Across Multiple Jurisdictions
Platform operators have responded by establishing edge facilities in additional markets rather than relying on single large hubs. This approach gained momentum after regulatory updates in several states permitted expanded data handling requirements for online gambling systems. Figures from monitoring services indicate that platforms using distributed nodes saw stabilization in user retention rates even as overall traffic volumes rose through 2025 and into the current year. The same datasets reveal that cross-border traffic routing sometimes introduces variability when latency spikes occur during peak evening hours.
Case Examples from Aggregated Operations
Take one multi-state aggregator that shifted portions of its traffic to a newly opened facility in the Midwest during early 2026. Internal metrics shared with industry observers showed immediate improvements in connection stability for users in adjacent states, accompanied by a measurable uptick in the number of completed bonus rounds per active account. Similar adjustments in European markets, where operators consolidated servers closer to population centers, produced parallel shifts in time-on-site statistics according to reports compiled by academic researchers tracking digital gambling infrastructure.

What's notable is how these changes interact with device type. Mobile users show sharper sensitivity to proximity because cellular networks already add variable delay, whereas desktop connections through fiber maintain more consistent performance even at moderate distances. Data collected across aggregated platforms confirms that mobile engagement drops more steeply when routing paths lengthen, leading some operators to prioritize mobile-optimized edge nodes in high-density urban areas.
Regulatory and Technical Considerations
Government agencies in multiple regions now require operators to report infrastructure details as part of licensing renewals, which has produced larger public datasets on server placement. A recent compilation from Canadian provincial authorities highlighted that platforms meeting stricter latency thresholds maintained steadier user bases compared with those operating from more centralized locations. Technical standards from organizations such as the International Electrotechnical Commission further encourage redundancy planning that accounts for geographic distribution. Observers note these requirements have accelerated investment in regional facilities rather than continued reliance on legacy central servers.
Another source of comparative information comes from a joint academic project between institutions in Australia and Singapore that examined traffic patterns in the Asia-Pacific region. Their findings, released in mid-2026, indicated similar proximity effects on engagement levels within platforms serving multiple operators, with particular emphasis on how undersea cable routes influence cross-regional performance.
Conclusion
Available measurements demonstrate consistent relationships between data center proximity and activity indicators across aggregated casino platforms. Operators continue to adjust placements based on these correlations while regulatory bodies collect additional data to inform future standards. The patterns observed through August 2026 suggest that infrastructure decisions will remain tied to engagement outcomes as network demands evolve.